Manual
seeQTL: A searchable database for human eQTLs
seeQTL portal
Kai Xia (kxia@bios.unc.edu)
Overview
seeQTL is a genomic browser based eQTL database developed under Gbrowse 2.0.
The Landmark or Region: genomic coordinate of current genomic window. User can also input the search items here by Gene Symbol, dbSNP ID or genomic coordinate.
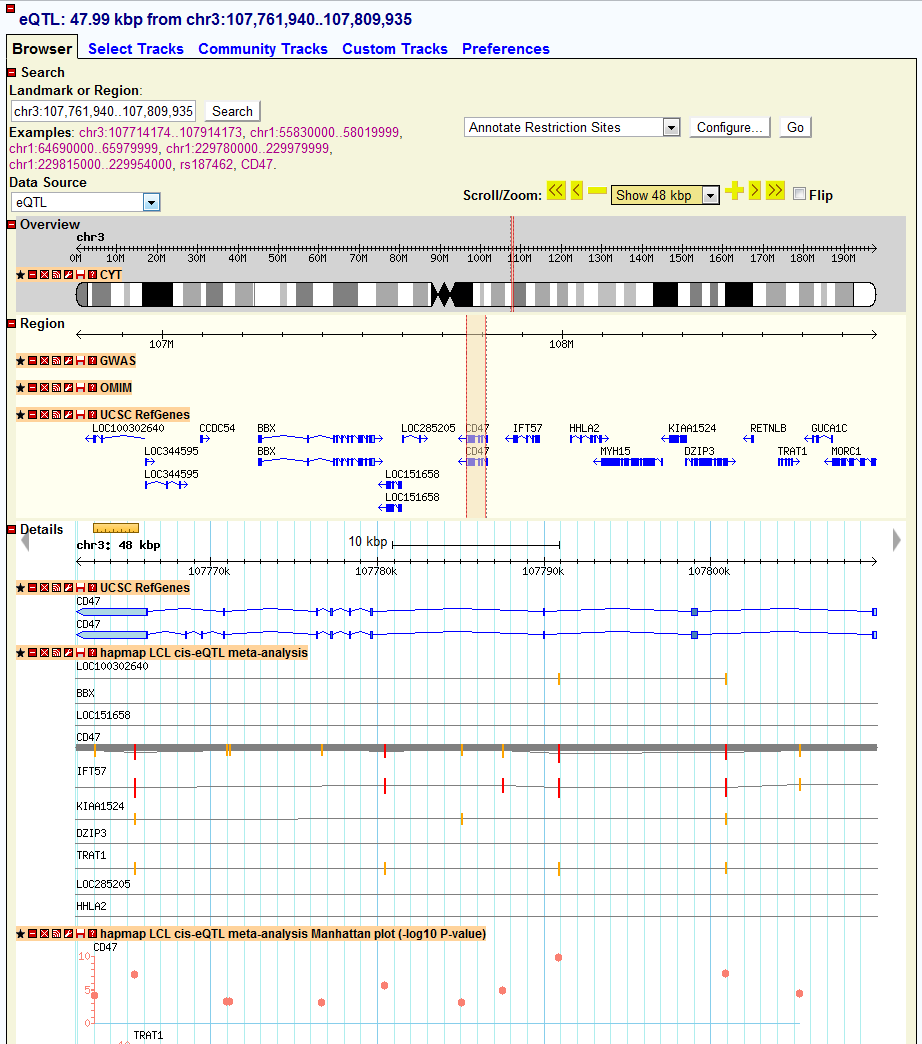
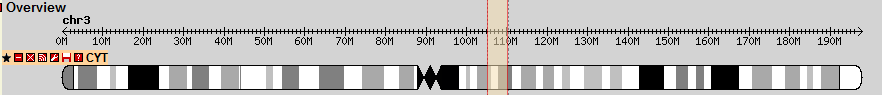
Overview section
CYT track: cytoband of the current chromosomes
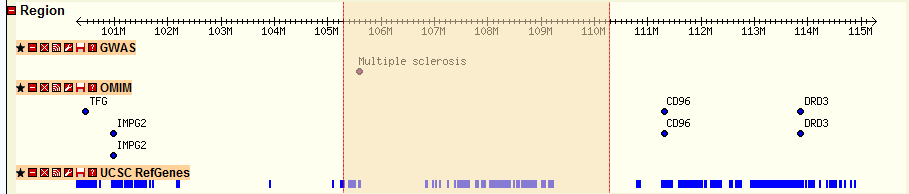
Region section
GWAS track: GWAS results from other study
OMIM track: OMIM information from Online Mendelian Inheritance in Man (OMIM)
UCSC RefGenes track: UCSC annotated RefSeq genes
Details section
UCSC RefGenes track: UCSC annotated RefSeq genes in a zoom in view
HapMap LCL cis-eQTL meta-analysis track: segment plot for meta-analysis of cis-eQTL of HapMap sample
HapMap LCL cis-eQTL meta-analysis Manhattan plot track: Manhattan plot for meta-analysis result of cis-eQTL of HapMap sample
Other tracks: either segment plot or Manhattan plot for other eQTL study
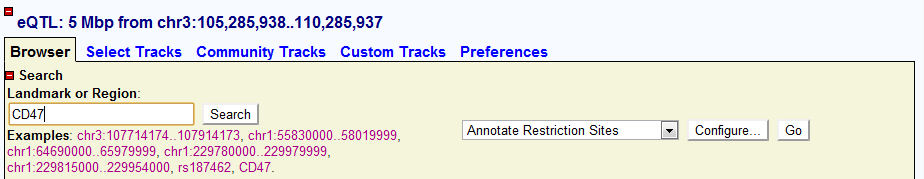
Search by Gene Symbol
Input the Official Gene Symbol in the “Landmark or Region” and click “Search” on the right
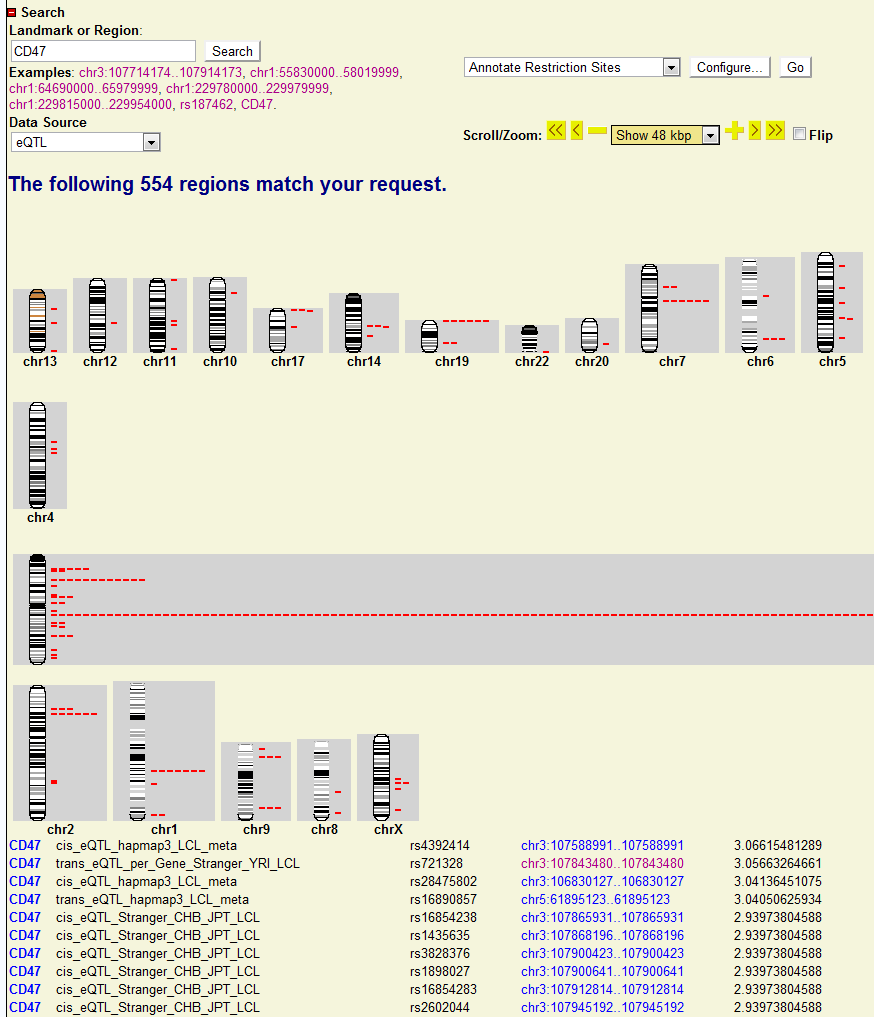
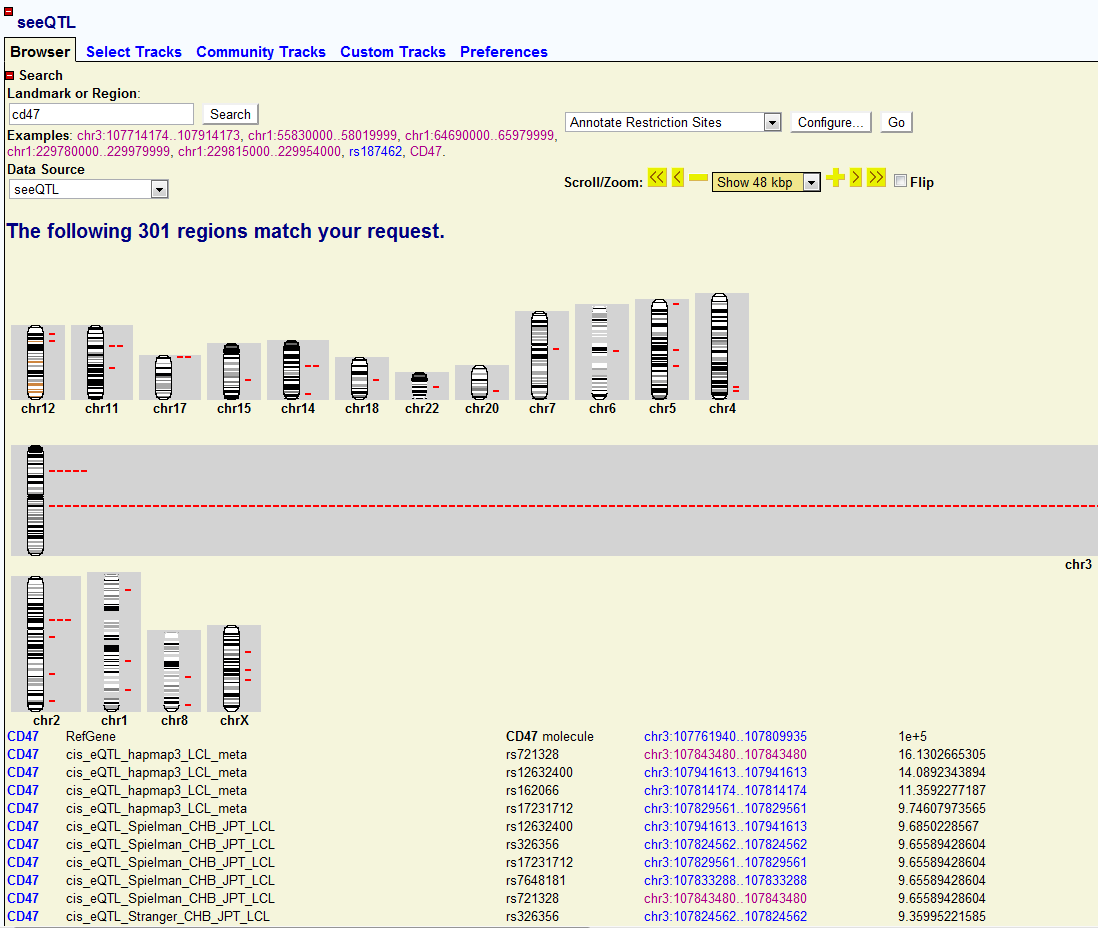
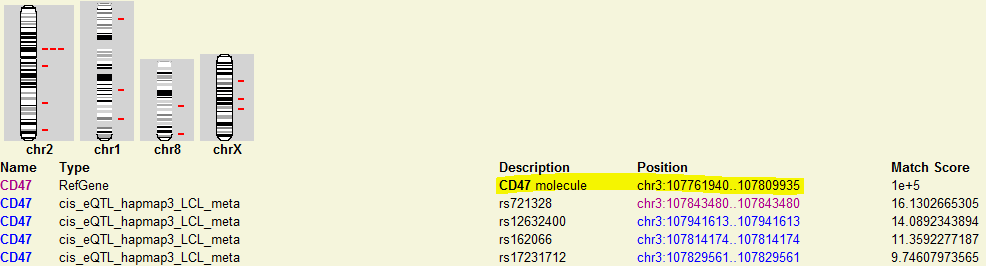
Users will be directed to another page showing whole genome view of CD47 associated SNPs. The detail of each association is also shown below in the tabular form. Users can also click each association and will be directed to the new genomic view page for particular SNP.
Search by SNP
Same place to input dbSNP ID
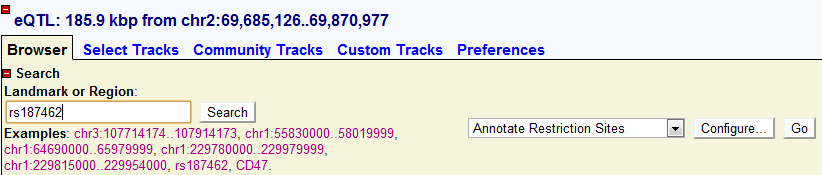
Users
will be directed to another page showing whole genome view of rs187462
associated genes. The detail of each association is also shown below in the
tabular form. Users can also click each association and will be directed to the
new genomic view page for particular genes.
Search by genomic coordinate
Users can also search by inputting genomic coordinate format like:
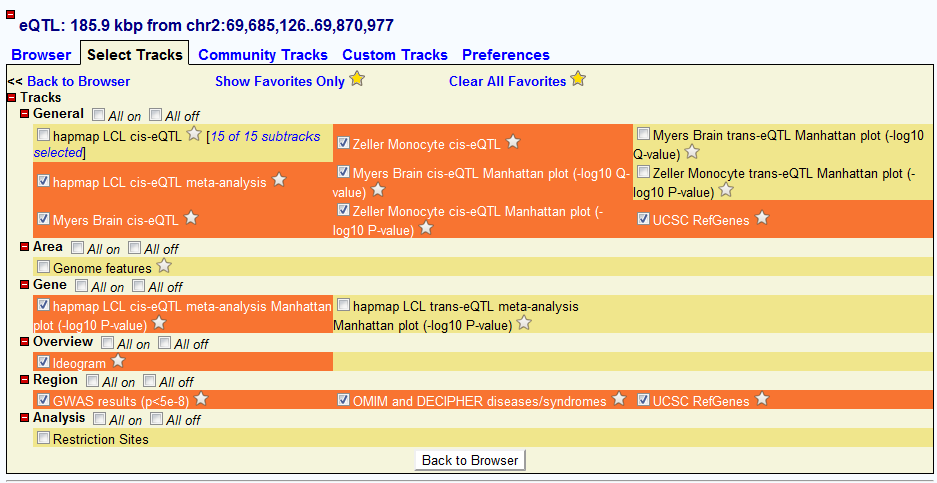
Select interested tracks
Users can also select their favored datasets and tracks to view. Once they go back to the “Brower” window, all the tracks will be updated based on the track they selected. The order of tracks can also be changed just by dragging in the in window when placing on each track name
Upload user P-values
Upload user P-values
Users can freely upload their customized sets of tracks. The tracks can be either gene, SNP, SNP P-values or other quantitative. The full description of uploading data and configuration can be found at (http://gbrowse.csbio.unc.edu/gbrowse2/annotation_help.html#remote). For user customized eQTLs or GWAS P-value, we suggest user to upload one track for each sets of SNP P-value. Users have to follow the WIG rules to prepare the file before upload. To properly visualize the tracks, users also need to set up the CONF files. We also suggest users to use �Clog10(P) to for each SNP P-value. We have prepared an example for the WIG file (gwas_snp_stat_Teslovich_HDL_CEU.txt.wig) and CONF file (wig_plot.conf) so that user can easily try to see how it works. See the documentation online for other details. Other important steps are shown below:
To help users convert their own P-value files (example : gwas_snp_stat_Teslovich_HDL_CEU.txt) to WIG format, we also provide a simple Python code: pval2wig.py, which can be used in Windows,
Linux or Mac.
The example SNP P-value is from Genome Wide Associations Scans for HDL-C (http://www.sph.umich.edu/csg/abecasis/public/lipids2010/)
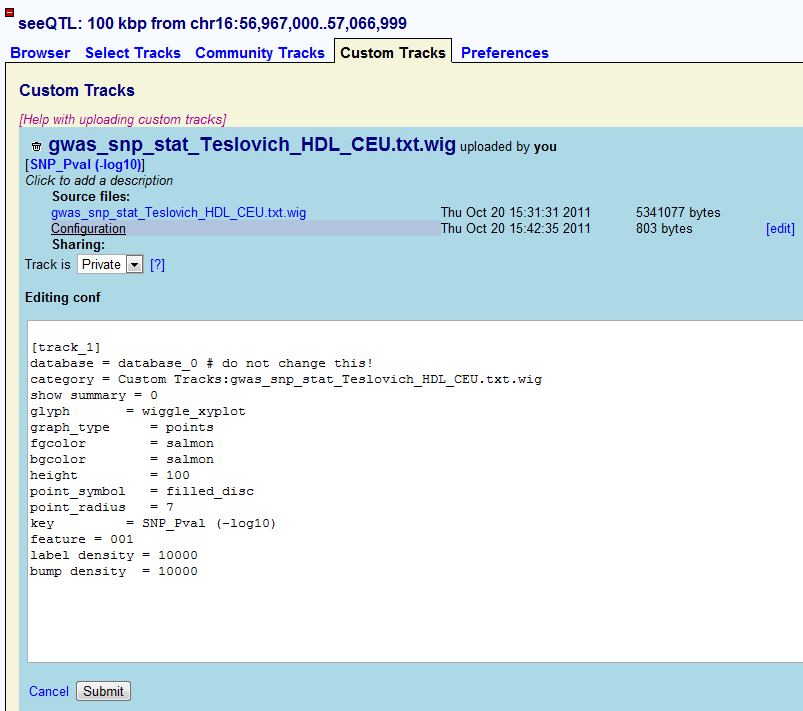
[track_1]
database = database_0 # do not change this!
category = Custom Tracks:gwas_snp_stat_Teslovich_HDL_CEU.txt.wig
show summary = 0
glyph       = wiggle_xyplot
graph_type     = points
gcolor        = salmon
bgcolor        = salmon
height         = 100
point_symbol   = filled_disc
point_radius   = 7
key         = SNP_Pval (-log10)
feature = 001
label density = 10000
bump density  = 10000
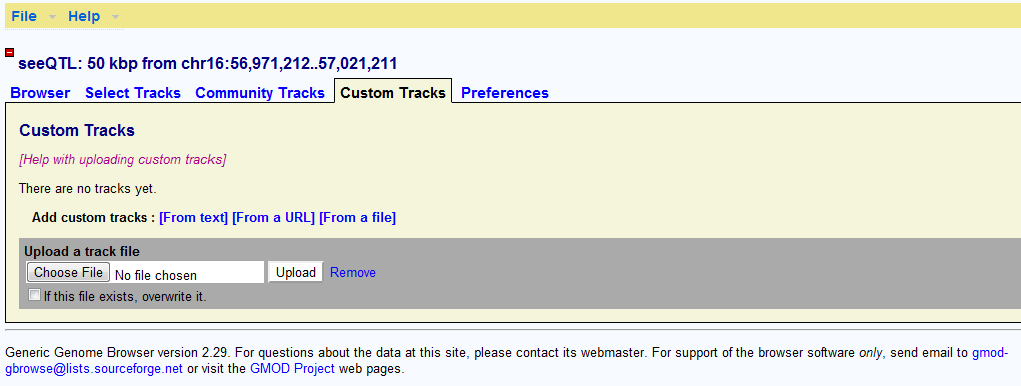
Select the file to upload:
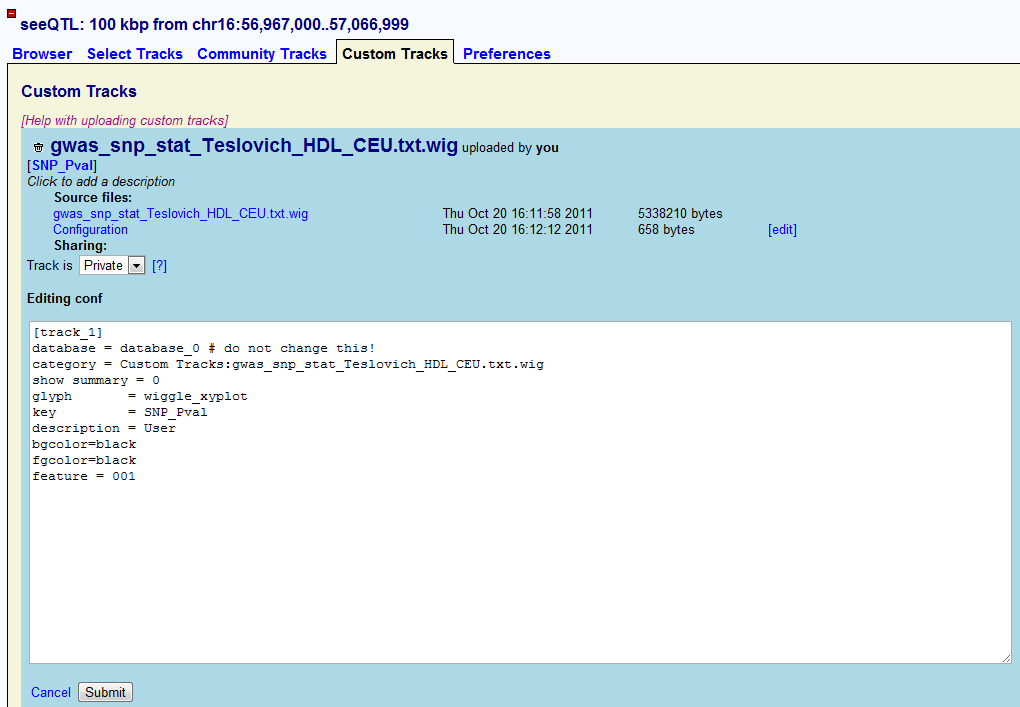
After finishing uploading the track, Gbrowse will generate a default configure file for the track you upload. It defines the track to show as box plot. By clicking the ��edit�� button on the right, users will be able to edit the configuration of their P-value track.
![]()
If users want to show their SNP P-value as Manhattan plot, we recommend users to use the following configuration (CONF file). Please keep in mind that the users cannot change ��database = database_0�� because it is where the uploaded tracks locate. After input the proper configuration file, user can submit and go back to the browser.
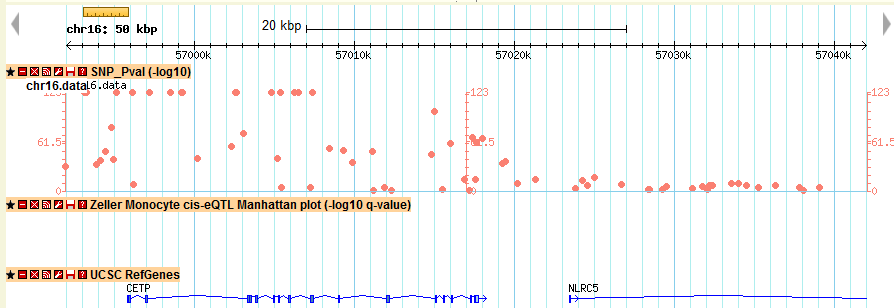
A new track named as SNP_Pval is shown in the browser, where users can easily navigate across the genome.
Let’s assume I am interested in gene CD47 and I would like to know how its gene expression is associated with other SNPs. I can just use the search engine of seeQTL to find the top associated SNPs across the genome among different eQTL datasets. All I need to do is:
- Search the CD47. A whole genomic view of CD47 associated map will be shown. I can easily find out where the CD47 associated SNPs locates across the genome.In this case, chr3 is enriched with a lot of associated SNPs. Since CD47 is also in chr3, the enrichment of associated SNPs just shows strong cis-associations of CD47 with adjacent SNPs (cis-eQTL or local-eQTL). Below the genomic view, I can also find the top associated list of SNPs together with their location and link. Each link will direct me to the genomic location it points to.
Where to search:
Genome
wide association map of CD47:
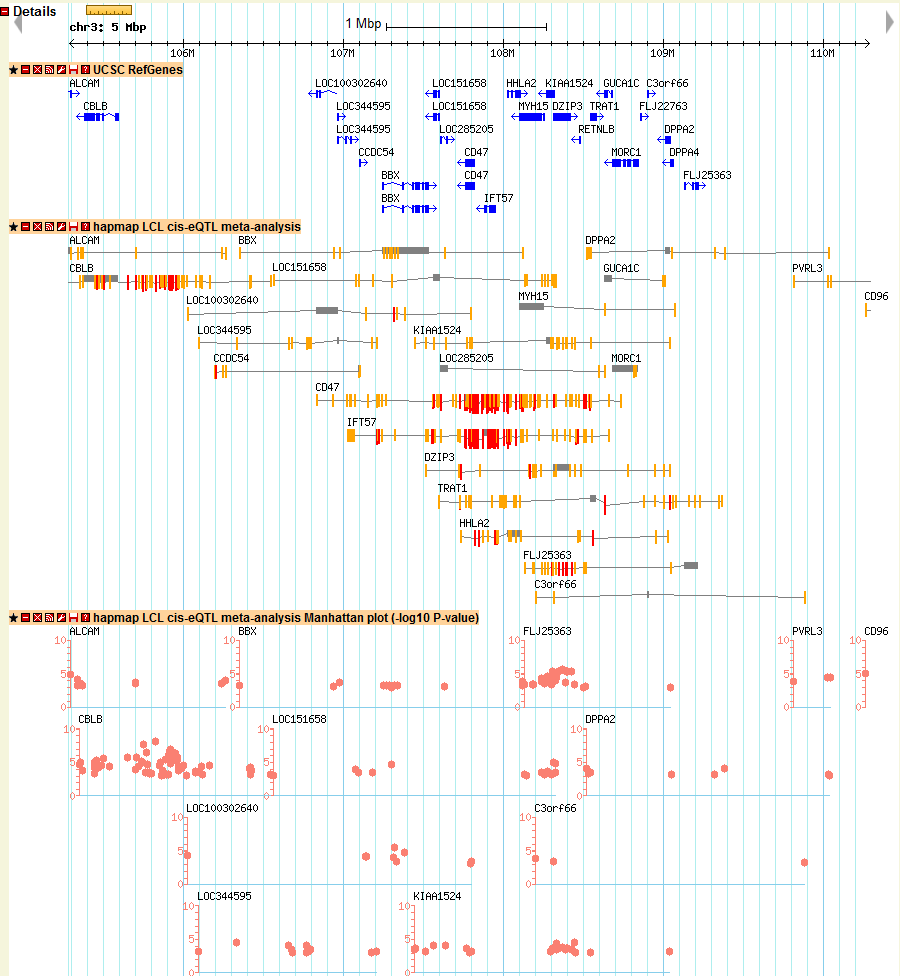
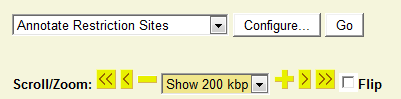
2) Then I want to see how the local eQTL affect the gene expression of CD47 gene location, I just click the location link of CD47 and directed to the genomic location of CD47. In the new window, I found many tracks of eQTLs and I am just interested the meta-analysis results here, I just look at the track named as “hapmap LCL cis-eQTL meta-analysis Manhattan plot”, which shows the Manhattan plot of location association of CD47. In the pictures below, I didn’t find many strong associated SNPs in the gene body of CD47. The reason is that sometimes the regulatory element is upstream (3′-UTR) or downstream (5′-UTR) of gene body. In order to check other SNPs close to CD47, I just select to zoom-out into a 200 kb windows. Then I can find a strong associated SNP in the 5′-UTR of CD47 with q-value > 10 (marked in green). That particular SNP could be the SNP regulating the gene expression of CD47.
Click the gene link:
Directed
to genomic location of CD47:
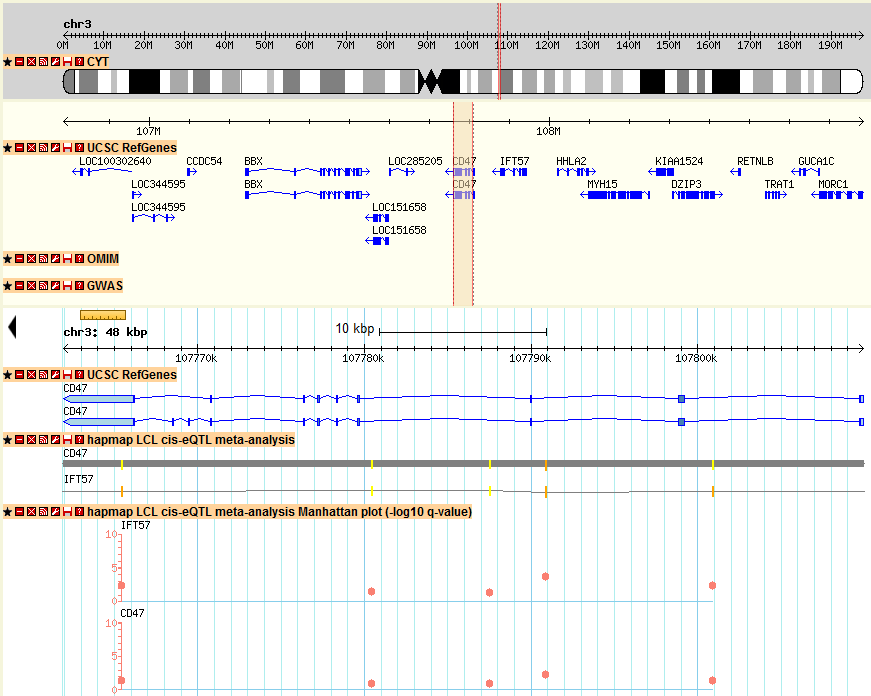
Zoom out to a 200 kbp window in the top-right panel of the page:
New windows showing Manhattan plot of more SNPs associated with CD47:
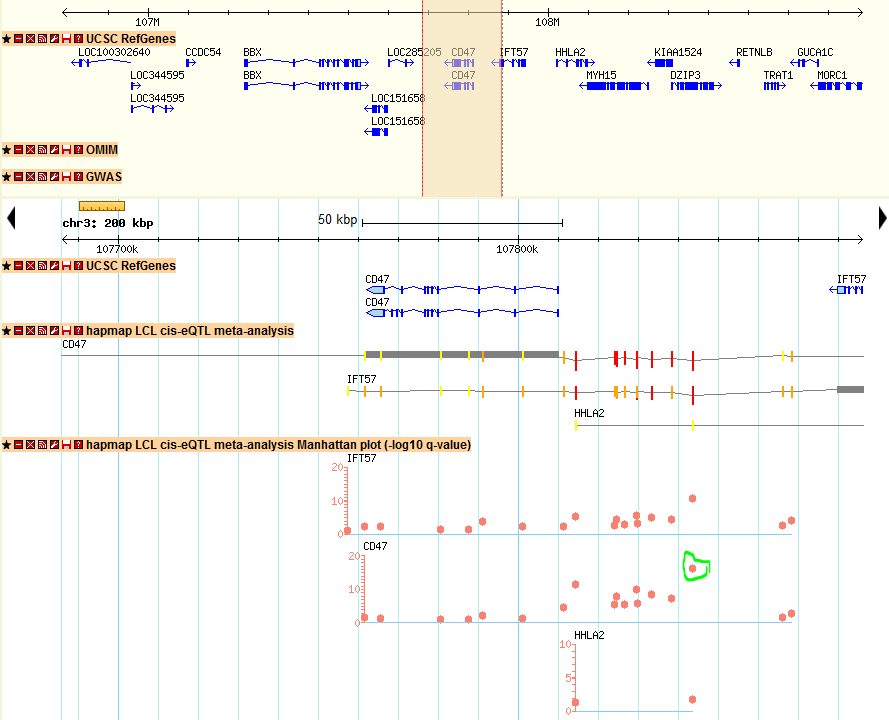
3) In the figure above, I also observed similar pattern of Manhattan plot for IFT57, which is a different gene upstream of CD47, this could be an indication that both genes are correlated and regulated by the same genomic regions. This example is just an illustration on how to explore seeQTL and find scientific interesting results. All the other genes and SNPs can be searched and browsed in the same way.