A resource for integrated genetical genomic analysis of the human liver
CLICK HERE TO ACCESS BROWSER
Key features:
-
Multiple liver datasets, including a microarray meta-analysis, and the UNC RNA-Seq liver study
-
Searchable database by dbSNP ID, Gene Symbol and genomic coordinate
-
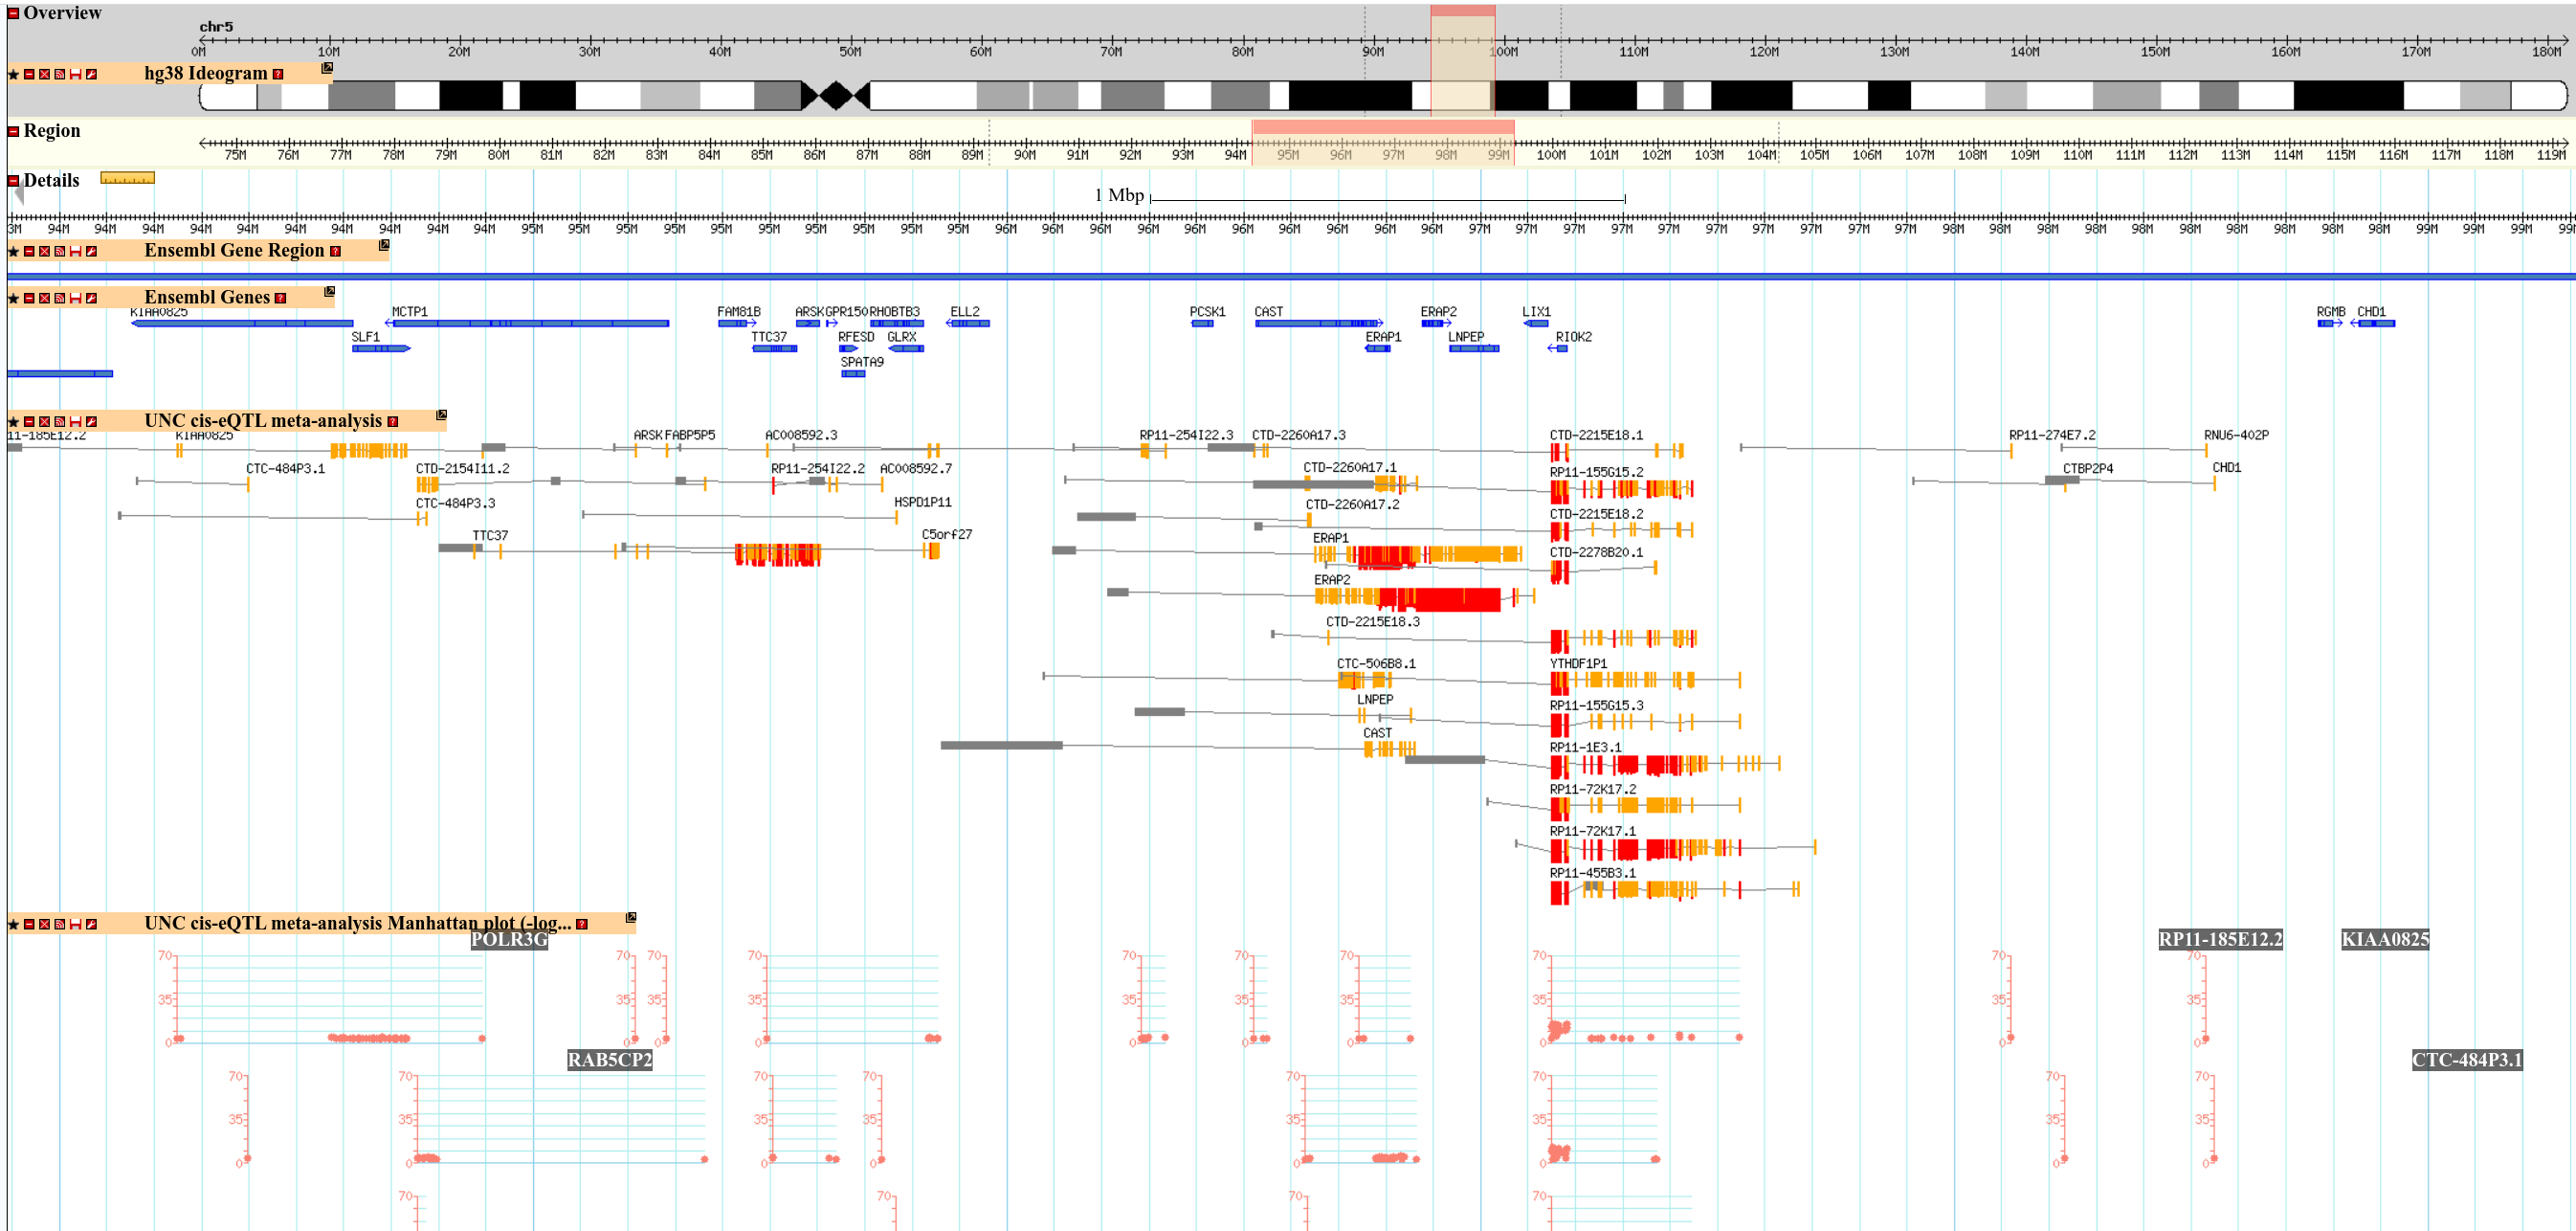
Segment plot of cis-eQTL for each gene
-
-
Bar shows location of gene body.
-
Segment shows SNP location.
-
Connected lines indicate cis-eQTL association
-
The height and color of each segment indicates strength of eQTL.
-
-
Manhattan plot for cis-eQTL
-
Gene based plots of associated eQTLs in the genomic window
-
Multiple plots if multiple genes in the genomic window
-
-
Population specific eQTL on different tracks or subtracks
-
Users’ selection of favored datasets or tracks